Graph-Based Impact Analysis for Large-Scale API Changes
Dependency graphs map what API changes touch across millions of client applications.
What a dependency graph represents and why the data structure fits this problem
APIs stopped being plumbing a while back. About 65% of organizations now pull revenue directly from them, and 74% of that group say APIs account for at least a tenth of total revenue. A breaking change is a business event with a P&L attached, and the dependency graph is the mechanism connecting "we changed a return type" to "a customer's checkout flow went dark," whether anyone bothers to draw the graph or not.
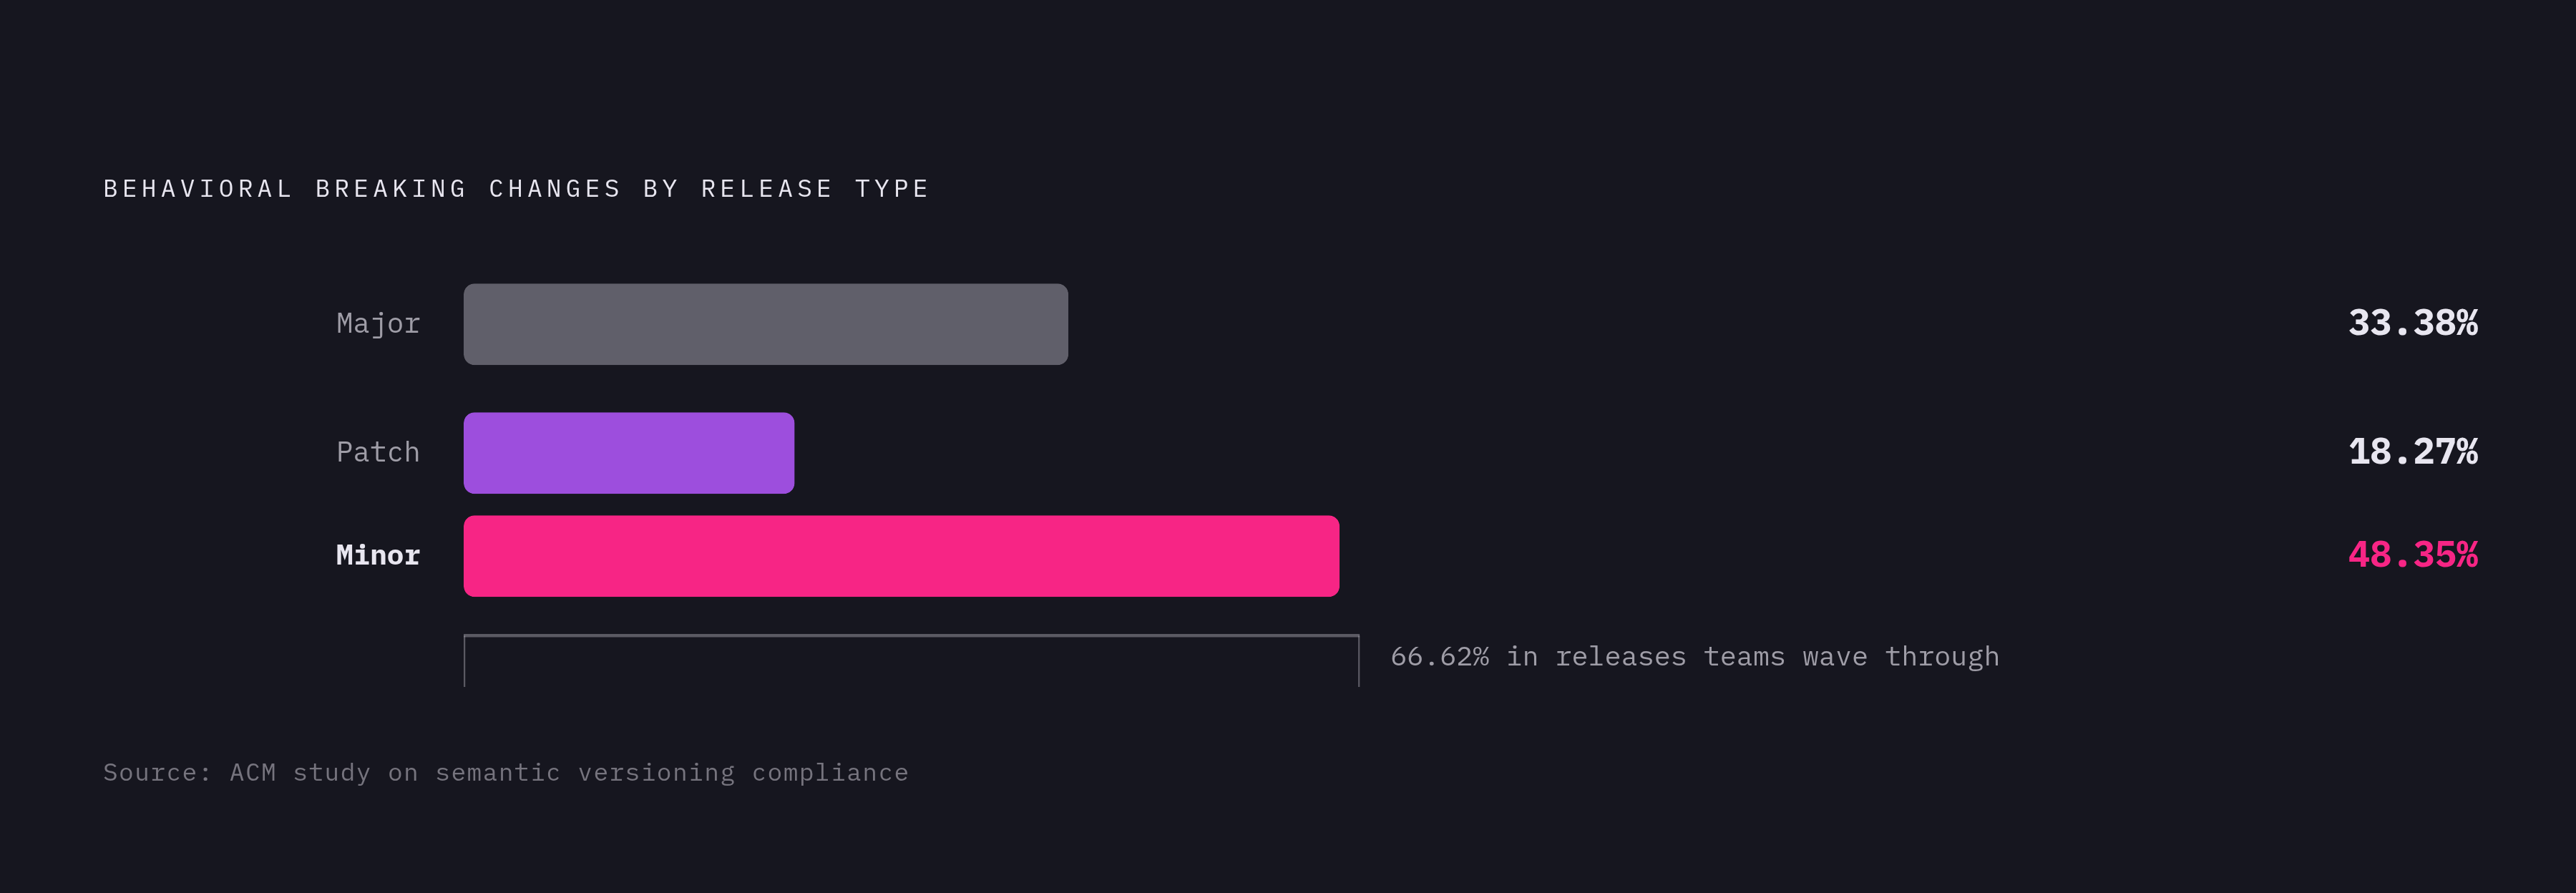
An IEEE study covering 317 Java libraries, roughly 9,000 releases, and 260,000 client applications found that 14.78% of API changes break compatibility somewhere downstream, and the rate climbs over time instead of settling down as codebases mature. Only 2.54% of clients get hit by any single change, on average. That sounds tame until you multiply it against 260,000 client applications, at which point 2.54% is a headcount, not a rounding error. According to an ACM study, 48.35% of detected behavioral breaking changes appear in minor releases, and another 18.27% occur in patch releases, the exact updates teams wave through with the least scrutiny because "it's just a patch."
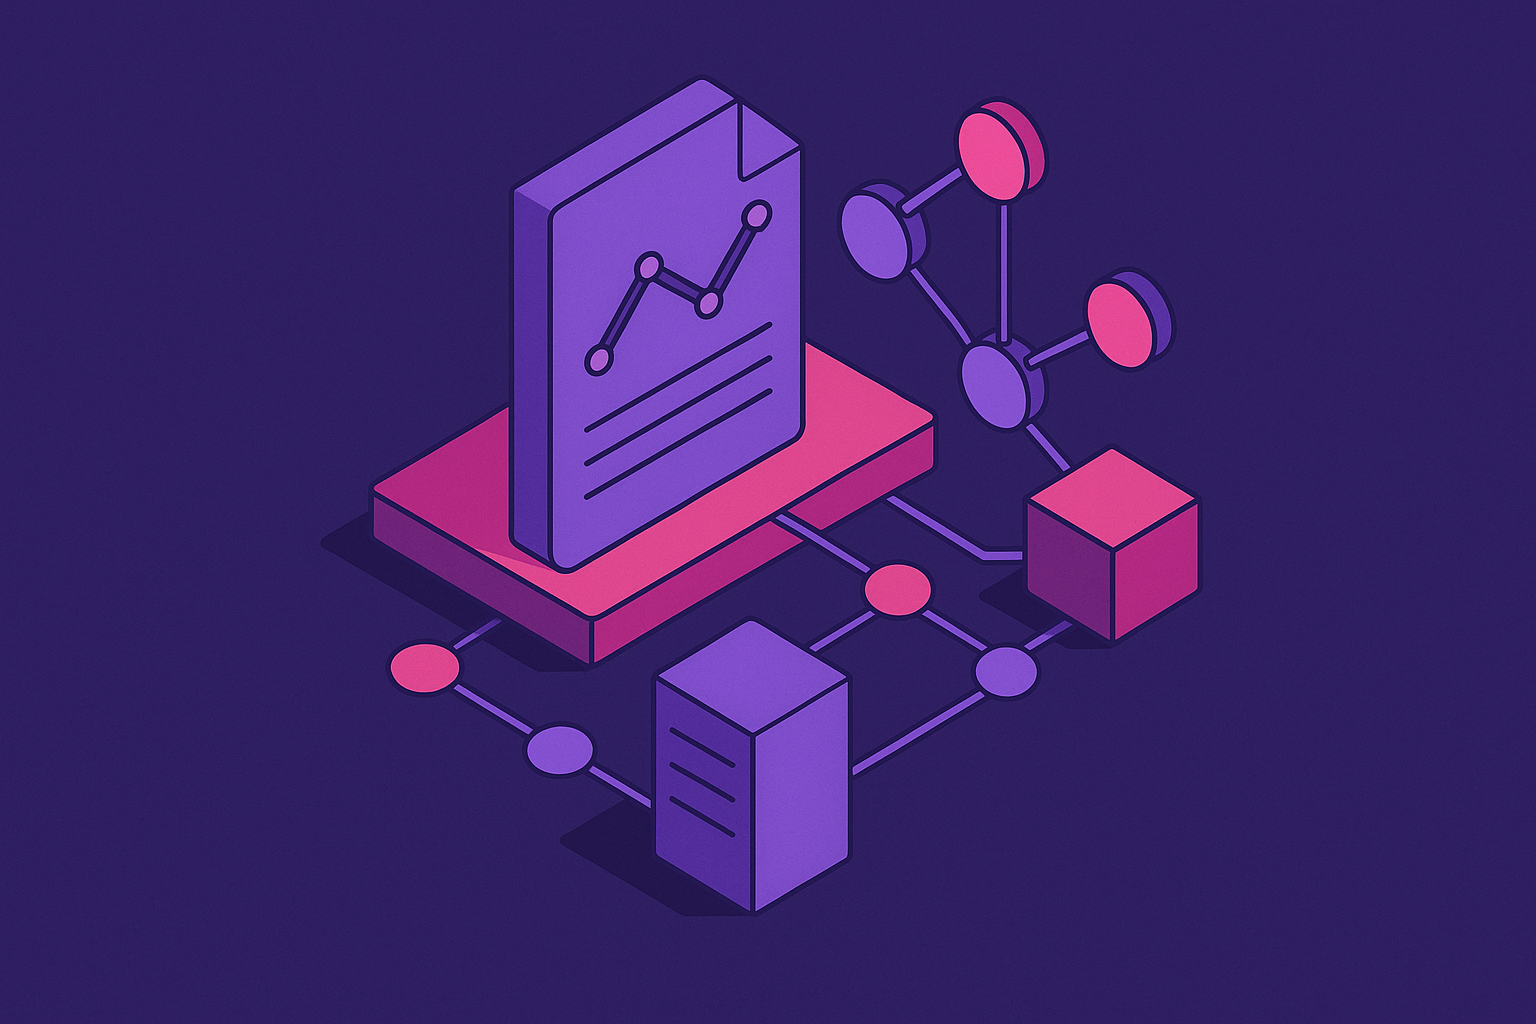
A dependency graph turns a codebase into something you query instead of something you read line by line. Nodes are entities such as a function, a class, or a service endpoint. Edges are relationships such as a call, an import, or an inheritance link. Changing a node causes the effect to reach every other node connected to it by a path, however long that path runs. A diff can't tell you that. A changelog can't either. Both tell you what moved, never what the movement touches.
Scale is what makes this a structural necessity, not a nice-to-have. In large enterprise systems, according to US Patent 8229778, a single compute resource typically carries somewhere between 10 and 100 direct relationships. At the instance level that number runs from a million to a billion. Nobody traces that by hand, and nobody should try. The graph exists to answer one question a file list never can: what does this change touch that nobody meant to touch?
The two-phase architecture that makes graph-based analysis scalable
USPTO patent 11,334,474 lays out the design most production systems in this space still follow, and it splits the work into two phases for a reason that has nothing to do with elegance. It comes down to query speed.
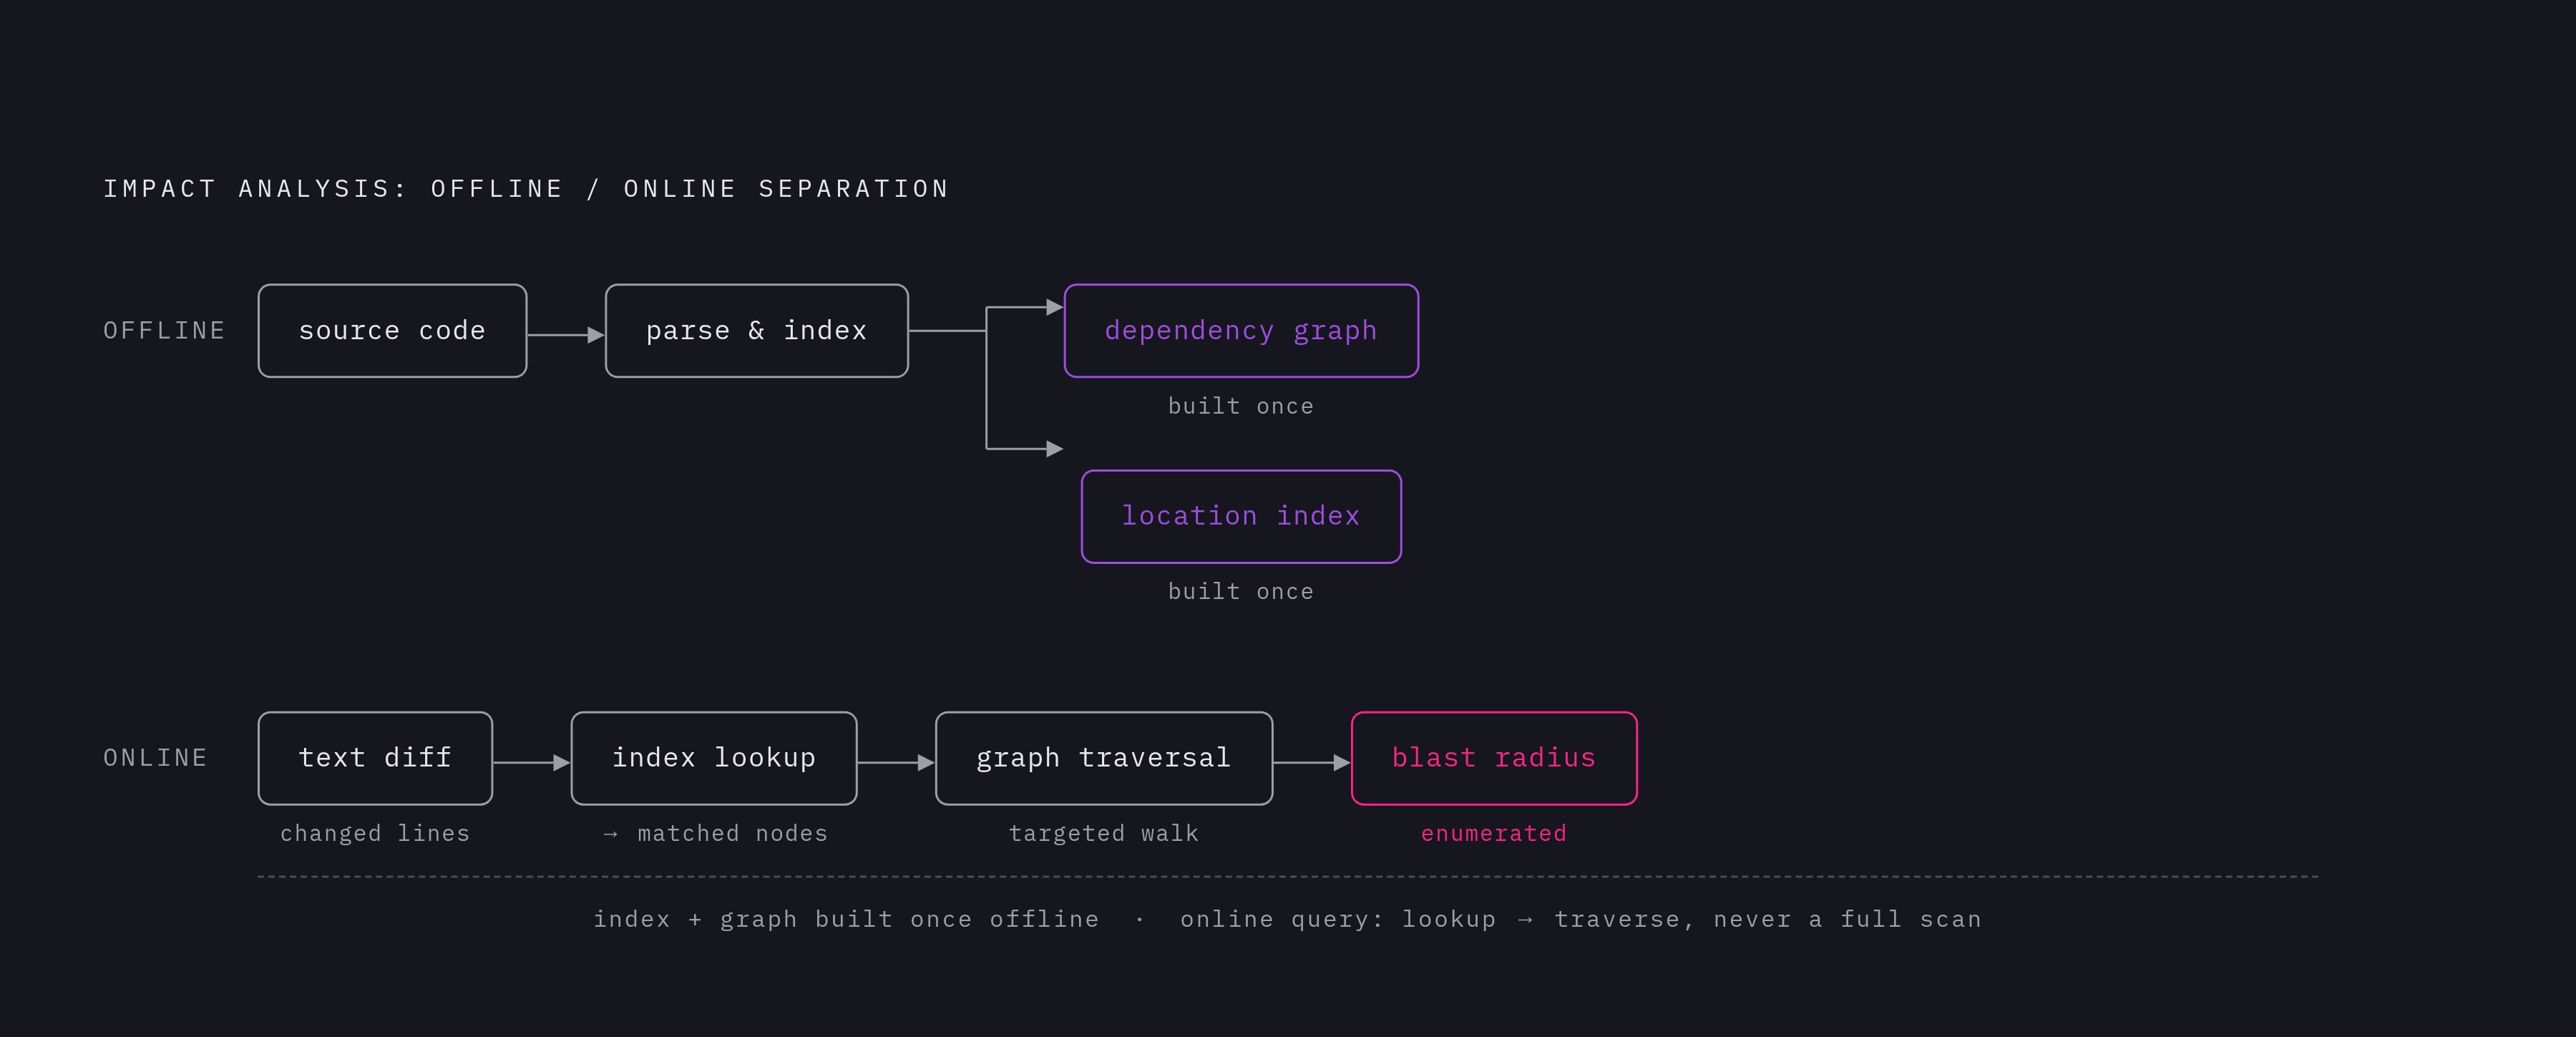
The offline phase happens before anyone proposes a change. A dependency graph gets built from the source code as it stands, and alongside it, a separate location index maps every location in the source to the specific node in the graph that represents it. That separation, index over here, graph over there, is the decision that makes the whole approach scale. Keep them apart and queries against the graph stay fast.
The online phase kicks in once a change is on the table. Modified locations get found by comparing the new source against the original, textually. Those locations get run against the location index to find matching graph nodes, and from there a traversal walks outward from each match, collecting every node reachable from it. What comes out the other end is the blast radius, enumerated as a concrete set instead of guessed at. Skipping the index forces every query to load and scan the entire graph from scratch. Keep it, and the online phase becomes a targeted lookup followed by a traversal that only goes as far as it needs to.
Choosing the right graph granularity for API impact work
Three flavors of dependency graph get used in practice, and the mistake most teams make is picking the one that sounds most rigorous instead of the one that answers the question in time to stop a costly late-stage fix.
A Program Dependence Graph captures individual code instructions. It's the finest-grained option, and also the one that stops scaling first: node and edge counts blow up fast enough that PDGs become impractical on any codebase of real size. At the other end, a class or package dependency graph stays small enough to query fast, but it misses the call-level detail that would tell you whether an intra-class change actually reaches a consumer. A call graph sits between the two, tracking which functions call which, and research on impact prediction at scale keeps landing on call graphs as the right trade-off between build cost and what they actually catch. That's the one to build a workflow around. PDGs are overkill and package graphs are too blunt, and there's no third option worth the build time.
Microservice architectures complicate the picture further. Call graphs there aren't static snapshots; they shift as services deploy, scale, and retire. A production cluster's service dependency graph is really many call graphs stitched together, with topology and invocation patterns varied enough that clustering methods become useful for managing the complexity. Depth carries its own cost too: as call chains get deeper in a microservice mesh, query latency against that graph climbs with it. Granularity decisions here aren't just about analysis accuracy. They decide how fast the system answers back, and a slow answer during an incident is close to no answer.
Static versus dynamic analysis
Static analysis reads source code, config files, and manifests without running anything, fast enough for real-time CI feedback. It picks up declared relationships: imports, direct calls, inheritance. What it can't see is anything that only exists at runtime, and that list is longer than most teams assume: Java reflection, late binding, polymorphic method overriding, dependencies implied by a config file rather than declared in code. Those all produce edges a static scanner has no way to recover, so static analysis ships with both false positives (flagging impacts that will never happen) and false negatives (missing impacts that will).
Dynamic analysis fixes some of that by instrumenting running code and recording what actually gets called. It handles dynamic binding and polymorphism far better, and it reveals config-driven dependencies, visible only by observing runtime behavior, that static analysis simply cannot see. But it needs the system running, plus a set of usage scenarios exercised against it, and none of that updates in real time without re-running tests. Coverage is the deeper problem: getting enough runtime coverage to trust the resulting call graph is not practically achievable for any system of real size. Every code path the tests don't exercise is a silent gap in the graph, and there's no clean way to know how big that gap is until something falls through it.
Static analysis carries the weight of everyday CI feedback. Dynamic analysis gets used selectively, to check or fill in a static graph rather than replace it, and treating it as a replacement is a mistake teams keep making anyway. Neither one, alone or combined, handles what's sometimes called a ghost dependency: a relationship that exists at runtime but was never declared in any manifest. Ghost dependencies represent a residual risk that neither static nor dynamic analysis is designed to catch. Planning for that residual risk is part of the job, not an edge case to shrug off.
How production tools combine static reachability with compatibility checking
The pattern across research tooling is consistent: run a binary compatibility checker first to enumerate everything that changed at the API surface, then filter that list through call graph reachability to find out which of those changes any client actually invokes. Change detection alone produces noise. Reachability is the filter that turns noise into a priority list.
A handful of named systems show the pattern clearly. CORAL pairs off-the-shelf compatibility checkers, revapi, japicmp, japi-compliance-checker, with call graph reachability analysis. UPPDATERA uses GumTree to diff the AST of dependency changes and WALA's Class Hierarchy Analysis to build client call graphs, then narrows down to functions with actual control or data flow changes. Breaking-Good works from the other direction, correlating build log error locations with dependency version differences traced through the dependency tree, aimed at compilation failures specifically. UnCheckGuard runs static taint analysis alongside call graph construction to track how client input data flows into a library's exception sites, catching newly introduced unchecked exceptions before they surprise anyone in production. Maracas computes a delta model of breaking changes with japicmp and matches it against Rascal M3 models of client code to find impacted locations.
All five share the same blind spots, and that consistency is the point. Reflection slips past every one of them. Complex method-overriding chains get over-approximated by Class Hierarchy Analysis, so the tools are conservative in ways that generate false positives. And ghost dependencies, absent from the POM file by definition, are structurally invisible to a system built around declared dependencies. No single tool covers the full blast radius alone. The tools marketed as a complete answer aren't one. Pairing a spec-level checker, a call-graph reachability filter, and consumer contract tests covers more ground than any one of the three run in isolation, and that combination is closer to what mature teams actually run.
The tooling landscape teams are using in 2026
On the spec-diffing side, oasdiff is the open-source workhorse: run it as a CLI or a GitHub Action, or use it for a quick side-by-side spec comparison, and it supports OpenAPI 3.0, 3.1, and 3.2. It sorts findings into ERR (definitely breaking) and WARN (might be breaking, can't be confirmed programmatically), with an additional INFO level available through its changelog command, across hundreds of individual checks. Optic, a tool that covered similar ground, was archived in January 2026, and APInotes has stepped in as the actively maintained option for OpenAPI diffing and breaking-change detection.
Contract testing covers the layer spec diffing can't reach. PactFlow offers a CLI that uses AI to auto-generate test suites straight from an OpenAPI spec, then verifies in CI that the implementation actually matches what the spec promises. It has also launched an MCP server aimed at AI coding agent integration, and it's one of the few tools in this space with real machine learning behind it, which produces genuine detection rather than pattern matching dressed up as AI. The broader Pact-style model, where each consumer describes what it expects and providers run those expectations as tests before shipping, catches the behavioral breaks a spec diff has no way to see: the spec can look identical while runtime behavior independently shifts, a mismatch only detectable by running the actual expectations as tests.
AI-augmented graph tools are the newer entrant, and here the hype outruns the substance more than anywhere else in this landscape. The pitch: submit code, get a semantic diff back along with a dependency graph that flags broken contracts, version mismatches, and rollback complexity, reasoning across specs, logs, and commit history to surface calls that would otherwise stay hidden. Teams using this kind of analysis report cutting analysis time by as much as 70% in certain contexts. But most tools marketed as "AI-powered" for breaking-change detection are still rule-based systems doing pattern matching under an AI label, and buyers should read the spec sheet before believing the pitch deck. As of early 2026, tools with real machine learning behind them remain the exception. Google Apigee is one of the documented exceptions: it studies historical API traffic, learns what normal looks like at the environment level, and flags anomalies in live traffic against that baseline. That's detection after the fact, not prediction of what a proposed change will do before it ships, and the distinction matters for anyone deciding where a tool belongs in the workflow.
There's also a patent-level approach built for resiliency testing specifically. USPTO patent 10,810,112 describes a method that describes a method for ranking tests so the tests most likely to expose a high-blast-radius failure run first, using an annotated graph structure to guide that prioritization.
Graph neural networks extending impact analysis to dynamic topologies
Static graphs have a shelf life. A graph built at commit time describes the system as it existed then, but microservice topologies keep moving: services deploy, scale up, scale down, and retire continuously, so the graph and the running system drift apart the moment either one changes.
A 2026 paper in a Springer venue proposes a graph neural network framework built to model service dependencies and predict failure propagation across topologies that keep shifting, since conventional monitoring tends to catch this cascading-failure risk only after the fact. The framework runs through four layers: data collection feeds graph construction, which feeds a GNN processing engine, which produces a prediction output. Its core mechanism is a multi-layer GNN combining attention, temporal modeling, and message passing, built to capture how dependency patterns change shape over time rather than treating the graph as a fixed snapshot.
A related idea, the Component Dependency Evolution Graph, adds two axes to a standard static graph: time, tracking version evolution, and semantics, tracking how a vulnerability propagates. It establishes static dependency edges and links version lineages together so the graph can trace how a vulnerability or a breaking change moves across versions as they roll out, rather than across a single snapshot in time.
Putting graph-based analysis into a pre-release workflow
Without graph-based analysis, blast radius gets estimated the old way: memory, tribal knowledge, and hope that someone speaks up if a change looks risky. With it, the set of affected consumers gets enumerated before the release decision gets made, not after a customer files a ticket. That difference alone justifies the setup cost.
A layered pre-release check sequence follows from everything above, and skipping any one layer reopens exactly the gap that layer was built to close. Run a spec-level diff, oasdiff on every pull request touching an API surface, catching ERR-category breaks before code review even starts. Follow with a call graph reachability query against the offline graph, filtering the spec-level findings down to changes a real client actually invokes, cutting the noise that would otherwise bury reviewers. Close with a consumer contract test run, Pact-style, confirming every registered consumer's behavioral expectations still hold. That last step catches what spec diffing structurally cannot: a behavioral break hiding behind an unchanged interface.
Run in that order, spec diff, reachability filter, contract test, each layer catches what the one before it missed. None of the three replaces the others, and treating any single one as sufficient is exactly the gap the 14.78% break rate and the 48.35% minor-release figure describe.